“Recognizing the Potential for Losses When Investing”
by Aedan Bingham (WPI Student) and Alexander Smith (WPI Faculty)
One of the hardest parts of investing is sticking to your long-term plan when markets crash and you lose money. It takes psychological and emotional fortitude. It might also help to have realistic expectations about the potential for losses before you start investing. That would make losses less shocking. But it’s not clear whether people have accurate expectations.
Our view is that the issue can be approached from two angles:
- Do people correctly anticipate the frequency of losses?
- Do people correctly anticipate the severity of losses that occur?
To answer these questions, when Alex recently spoke to a group of students about investing, he explained that the S&P 500 Index is a weighted average of the stock prices of the 500 largest companies whose stocks trade on US stock exchanges. Alex then shared that over the past 100 years, the average annual rate of return of the S&P 500 Index (or its predecessors) has been just over 10% (including dividends but not accounting for inflation). Next, Alex asked:
“In how many of the last 100 years has the S&P 500 Index (or its predecessors) lost money?”
Aedan and Alex had different expectations about how students would answer. Aedan routinely hears his peers speak with concern and trepidation about stock market downturns whenever such events are in the news. Students appear to be focused on negative events, and so Aedan thought they’d estimate that the S&P 500 loses money reasonably often, or about a third of the time. Alex speculated that youthful optimism would lead students to underestimate the frequency of losses.
The correct answer is that the S&P 500 has lost money in 29 of the last 100 years, or almost a third of the time. Before we share the students’ answers, we should say that the students are undergraduates at an engineering university. They’re excellent with numbers, but don’t have significant investing experience yet. Sixty-nine were in attendance and 60 voluntarily submitted open-ended responses through a web-based polling system. Fifty-seven of the open-ended responses were well-defined numbers between 0 and 100, and we’ve graphed those answers in the figure below.
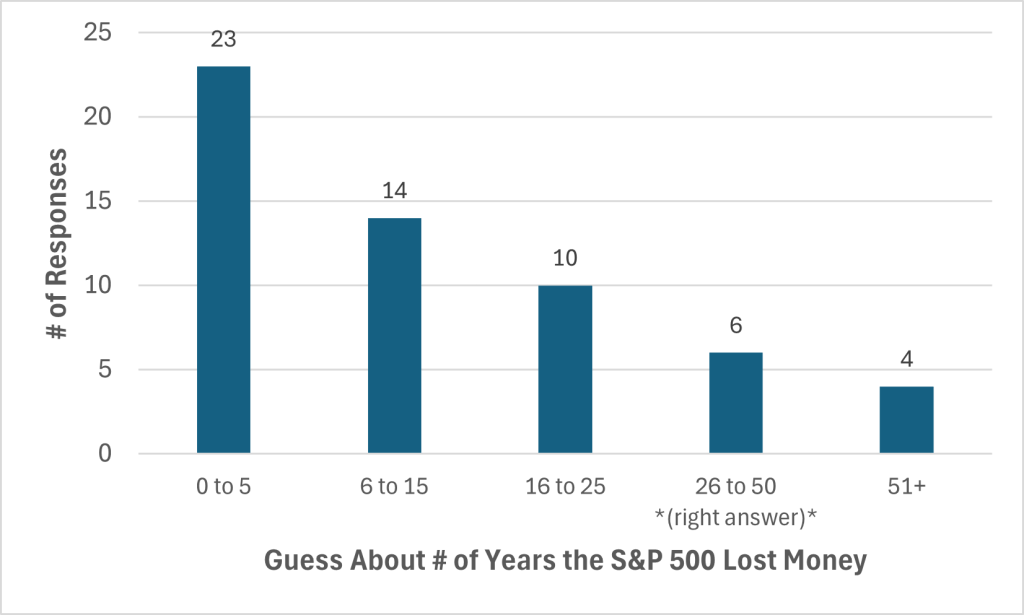
The students underestimated the number of losing years. In fact, 47 of the 57 guesses were less than the correct answer of 29 years. The average (mean) guess was 15.65 years, pulled upward by 6 guesses of 50 years or more. The middle (median) guess was 9 years, and the most common (mode) guess was 0 (11 people).
Aedan was surprised by the optimism of his peers. Alex was nonchalant. We together concluded that the evidence is strong that young people underestimate how often the S&P 500 loses money.
The second question was:
“In the losing years, what was the average percent loss?”
Here, Aedan figured that the pessimism of his peers would cause them to guess something like 25%. Alex once again put his faith in youthful optimism. The correct answer is that in the losing years, the average percent loss was 15%. We got 58 well-defined answers from the 69 students in attendance. See the answers in the graph below.
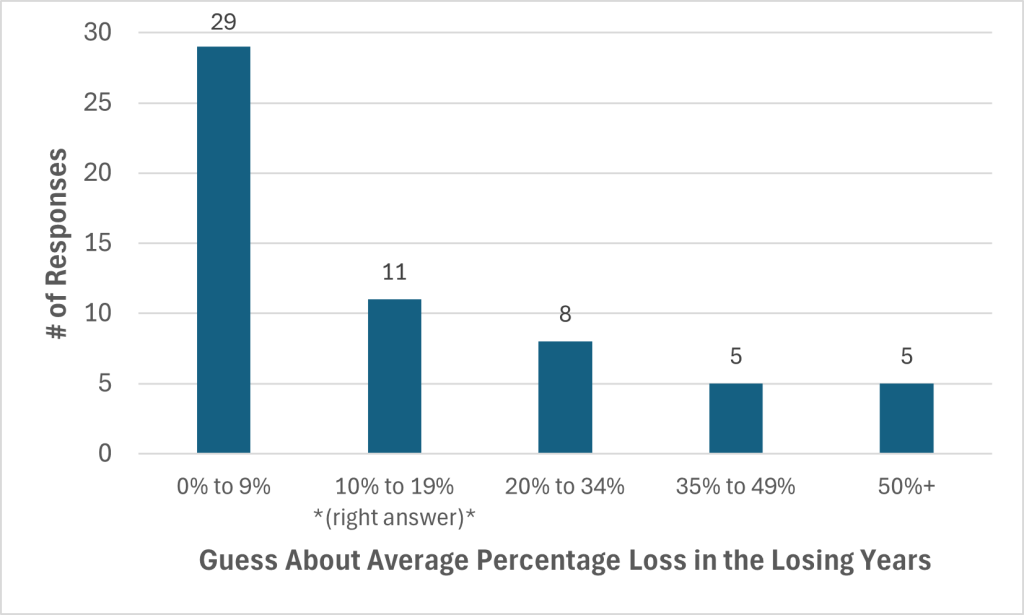
This time, 37 guesses were less than the correct answer (of 15%) and 19 were above it (one guess was exactly right). The average (mean) guess was 16.59%, pulled upward by 5 guesses of over 50%. The middle (median) guess was 9.5% and the most common (mode) guess was 5% (8 people). Since the mean is slightly above the correct answer and the median below, our overall interpretation is that the data are inconclusive on the issue of whether young people accurately anticipate the severity of losses. It seems that neither Aedan nor Alex can claim victory on this one.
The key results:
- Young people underestimate the frequency of stock market (S&P 500 Index) losses.
- While there’s some suggestive evidence that they might also underestimate the severity of losses, the data on severity are inconclusive.
Why does this matter? If people start investing with unrealistic expectations about the potential for losses, they might be more likely to get scared away from stocks during market downturns. We find that they indeed underestimate how often losses occur, but we can’t be definitive about perceptions of the average severity. Hopefully we don’t get scared away from learning more.
